An interpreter's guide · Neurosity Crown · for GFT Labs
The Neurosity Console, Decoded
The console gives you a screen full of numbers and almost no way to read them. Scan the takeaways below, then open any term for what it is, what it means about you, and what to do with it.
The 10-second version
Focus and Calm are a model's guesses, not measurements.
0.3 already counts as high. It is not a percentage.
Check signal quality before you trust any number.
Recordings keep your brainwaves but drop focus and calm.
For meditation, watch alpha rise across the session.
Screen 1The Live view
What you see while wearing the headset. Four numbers confuse everyone, plus a row of unexplained view toggles. Click a pin to jump to its entry.
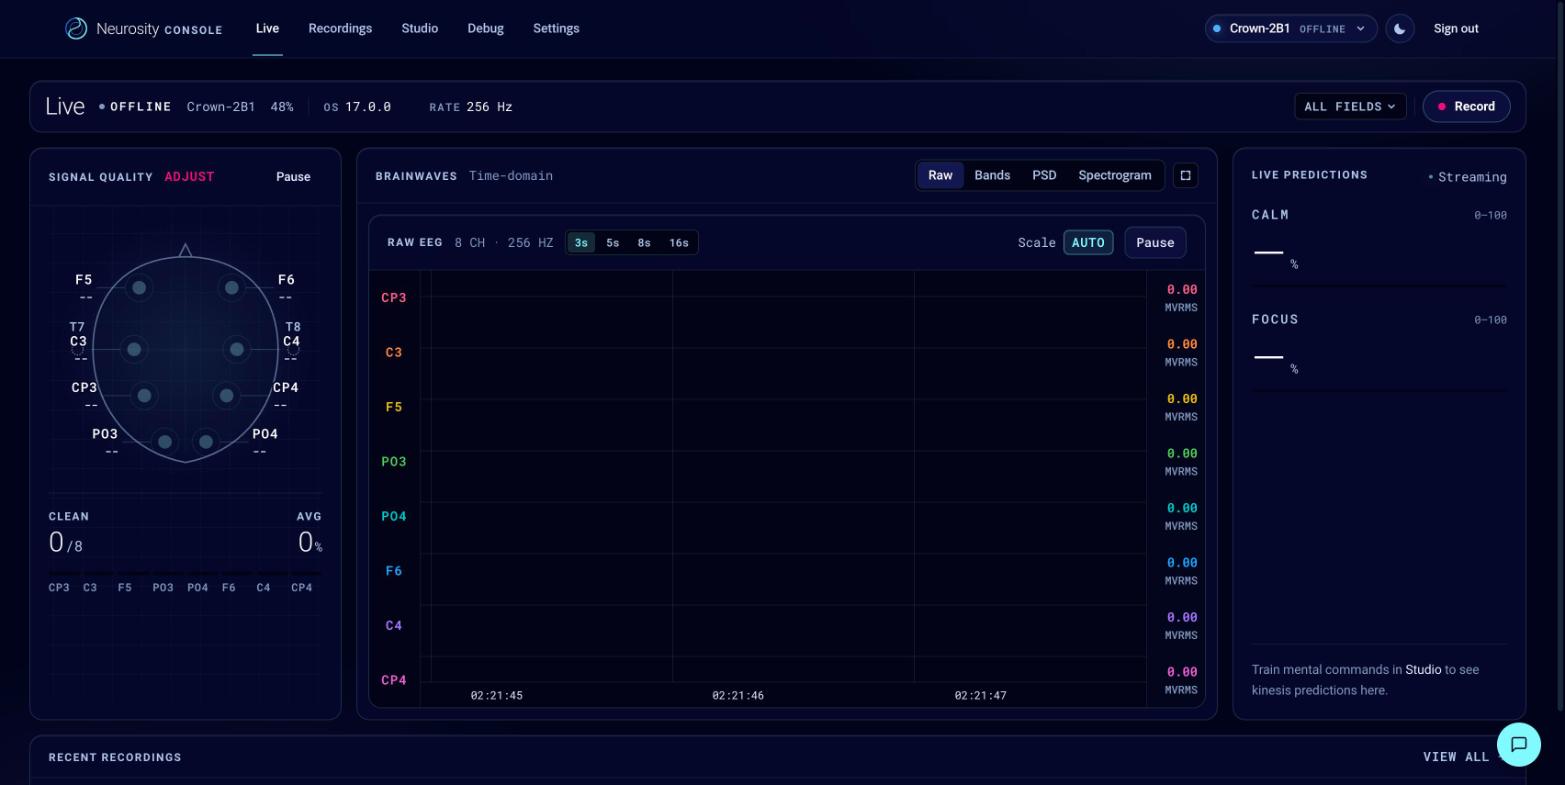
1The FOCUS scoreA model's guess from your gamma waves. Not a measurement, and 0.3 already counts as high.0 to 100›
A probability from a model Neurosity trained, built from gamma (30 to 44 Hz), the fastest band. Printed 0 to 100, but it is not a percentage.
Gamma tracks hard thinking, but it is also full of muscle noise from a clenched jaw or tense neck. And their docs call 0.3 significant, so 0.35 is not "35% focused". That misread is the most common one.
Compare it to your own baseline, watch the trend over minutes, and ignore spikes that line up with you moving.
Live only. It is gone the moment you stop recording.
2The CALM scoreThe same kind of guess from alpha waves. The score I trust more, and the meditation signal.0 to 100›
The same style of model output, from alpha (7.5 to 12.5 Hz), the rhythm that rises when you relax or close your eyes.
Alpha means idling more than "calm", a region powering down when unused. It is the cleaner, slower signal, so I treat calm as the more trustworthy of the two scores. The two building blocks are established EEG fact; the step to "therefore trust calm first" is my own conclusion, not something Neurosity says, and I set out the reasoning in Trust calm before focus.
This is the meditation signal, watch it climb. Read a rolling average, not single instants, which are noisy.
Needs about 16 seconds to warm up, and is discarded when you stop recording.
3µVRMS, beside the EEG tracesSignal size, not brain activity. A high number usually means noise.microvolts›
Microvolts, root mean square: the size of the voltage wiggle on a channel. A magnitude, nothing more.
Barely about your mind. A very high value usually means noise or a loose electrode, not more brain. Real scalp EEG is only tens of microvolts.
Use it to catch a bad channel: one reading far above its neighbours is junk.
Closer to a contact meter than a brain metric, despite sitting next to "brainwaves". Do not confuse it with the console's MVRMS quality figure below: that one is normalised and sits between 0.01 and 0.05, while this one is raw microvolts.
4Signal quality and Clean 0/8How many electrodes are truly touching. Check this before believing any other number.x / 8›
A map of the eight electrodes' contact, plus a count. Clean 3/8 means three are contacting well.
Nothing about your brain, everything about whether to trust the screen. An electrode on hair still prints confident nonsense.
Check it first, every time. Part hair under the sensors and wait for mostly green before a session you care about.
A gorgeous focus curve on a 1/8 signal is fiction. Gate every conclusion on this.
Pin 5The four ways to view the same signal
The Raw, Bands, PSD, Spectrogram toggles are four lenses on one stream of numbers. Here is the raw view, then all four.
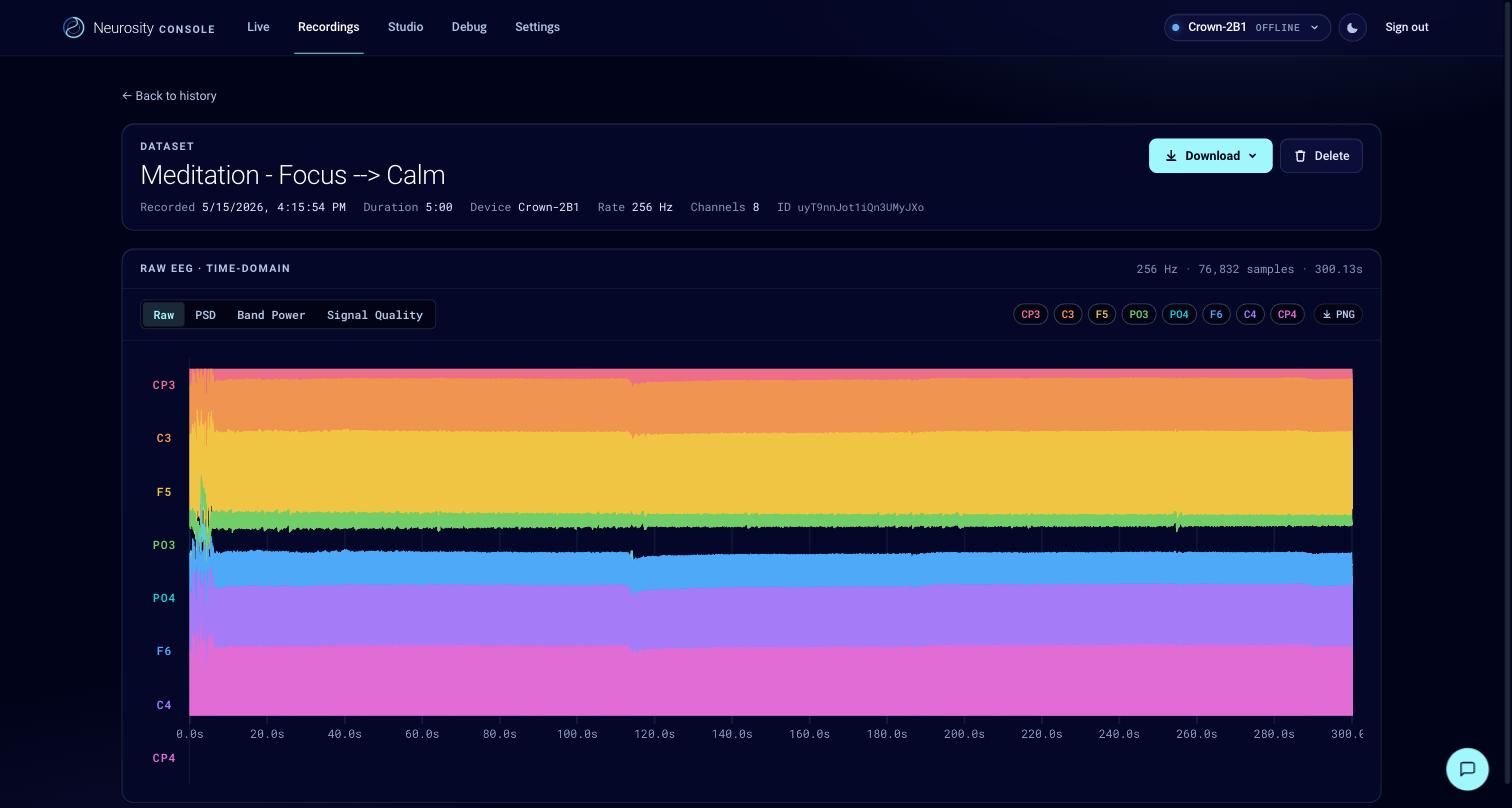
Raw, the wiggle itself
The raw voltage over time, one line per channel (the traces above). The signal before any interpretation.
Use it for spotting artifacts and checking the signal is alive.
Bands, sorted by speed
The signal split into the five bands (delta, theta, alpha, beta, gamma) as levels. The most interpretable live view.
Use it for watching alpha for relaxation or beta for engagement.
PSD, the frequency fingerprint
Power at every frequency right now, as one curve. The signal's frequency makeup rather than bands.
Use it for spotting a clean alpha bump near 10 Hz.
Spectrogram, frequency over time
The PSD rolled through time as a heat map: frequency up, time across, colour for power. It shows how the spectrum changes.
Use it for watching a band brighten or fade. The richest, busiest view.
Screen 2A recording
Your past sessions live under Recordings. Open one and you get four analysis tabs, and a telling absence.
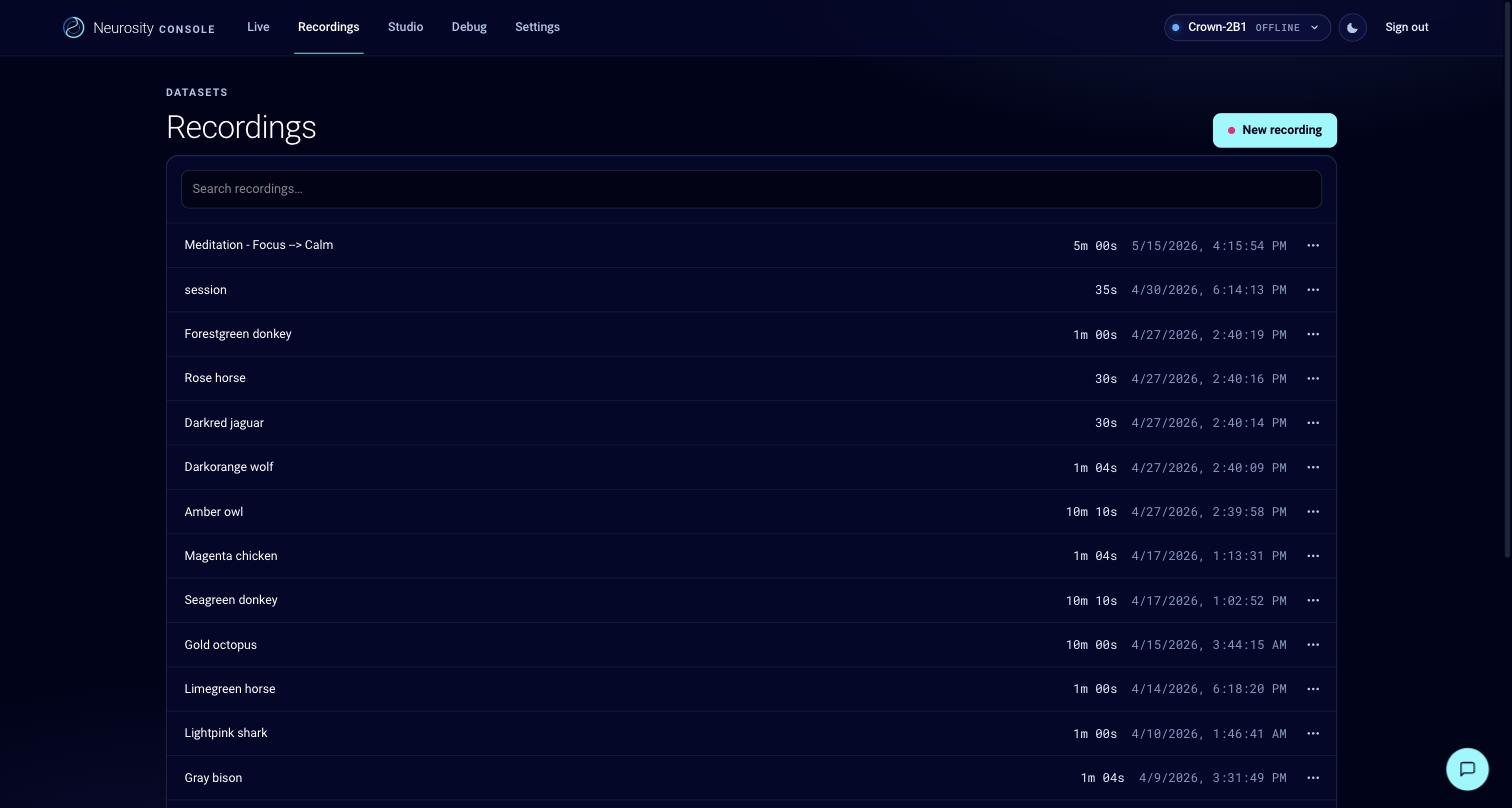
Each row is a saved session. Open one and this waits inside:
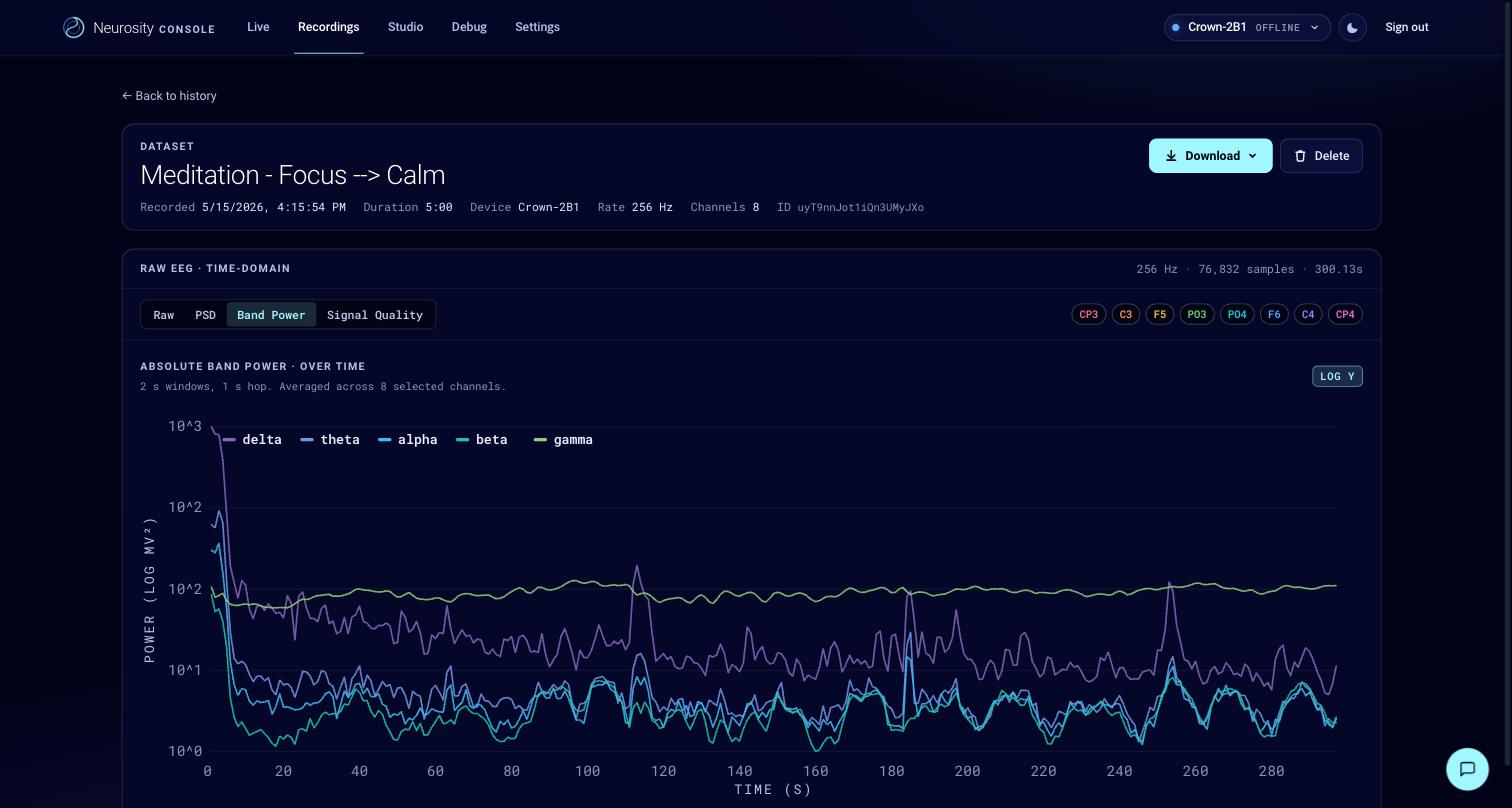
Four tabs (Raw, PSD, Band Power, Signal Quality), and no focus or calm anywhere.
6Band Power over timeYour brainwaves by speed, over time. Watch alpha and theta rise to see yourself settle.log µV²›
Your brainwaves split by speed and tracked over time, in 2 second windows, averaged across channels. Slow to fast: delta, theta, alpha, beta, gamma.
Delta being biggest is normal, power falls with frequency. Meaning lives in the movement: alpha and theta rising is the classic sign of settling. With focus and calm gone, this is your one real window into a session.
Track the alpha and theta lines. Rising and holding means you settled; flat and jagged means you never dropped in. Read the shape, not the height.
The LOG Y axis makes big changes look gentle. A doubling of power is a small step.
7PSD, power spectral densityThe session's frequency fingerprint in one curve. A bump near 10 Hz is healthy alpha.µV² / Hz›
One curve of how much power sits at each frequency across the whole recording. Every frequency, but time collapsed.
Healthy EEG slopes down from low to high (the 1/f shape). A bump near 10 Hz is your alpha peak, a good sign. Flat or spiky at high frequencies means noise.
A quick character check: real alpha bump, sensible slope. If it looks flat and noisy, trust the recording less.
It averages the whole session, so a calm start and restless end blur together.
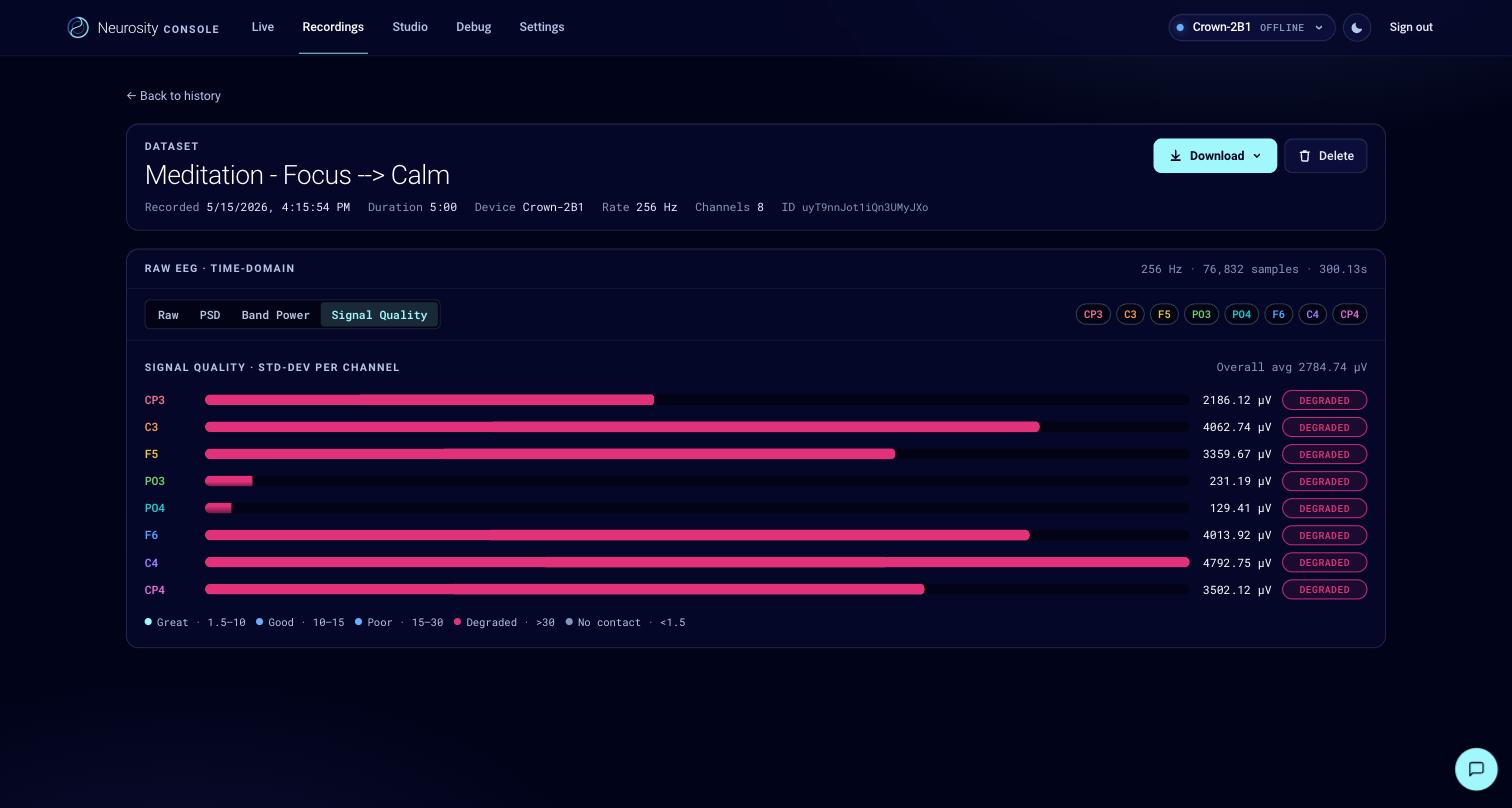
8Signal Quality, std-dev per channelHow noisy each channel was. It tells you which electrodes to trust, and which to bin.µV›
Per electrode, how much the voltage swings (its standard deviation, in microvolts), after removing slow drift.
Clean EEG swings by tens of microvolts; thousands means artifact, usually muscle. Frontal and central run noisy; posterior is often quietest.
Read a recording through its clean channels only, bin the loud ones. If all are loud, re-record.
The worked session does exactly this: only the two posterior channels survive.
∅The absence: no focus, no calmThe most important thing here is what is missing. Recordings never store your scores.›
A recording keeps Raw EEG, PSD, Band Power and Signal Quality, and nothing else. The focus and calm you watched live are simply gone.
The console judges your state in the moment, then discards it. You cannot ask "how focused was I on Tuesday", the number was never stored.
To review focus or calm later, capture it yourself as it streams. Otherwise read the session through band power.
The console is a live instrument, not a record, and never says so.
Screen 3The exports and the sensors
The last cluster of jargon: three download formats behind one button, and eight electrode names.
CSV, "one row per sample"Raw signal only, no focus or calm. You compute those yourself.›
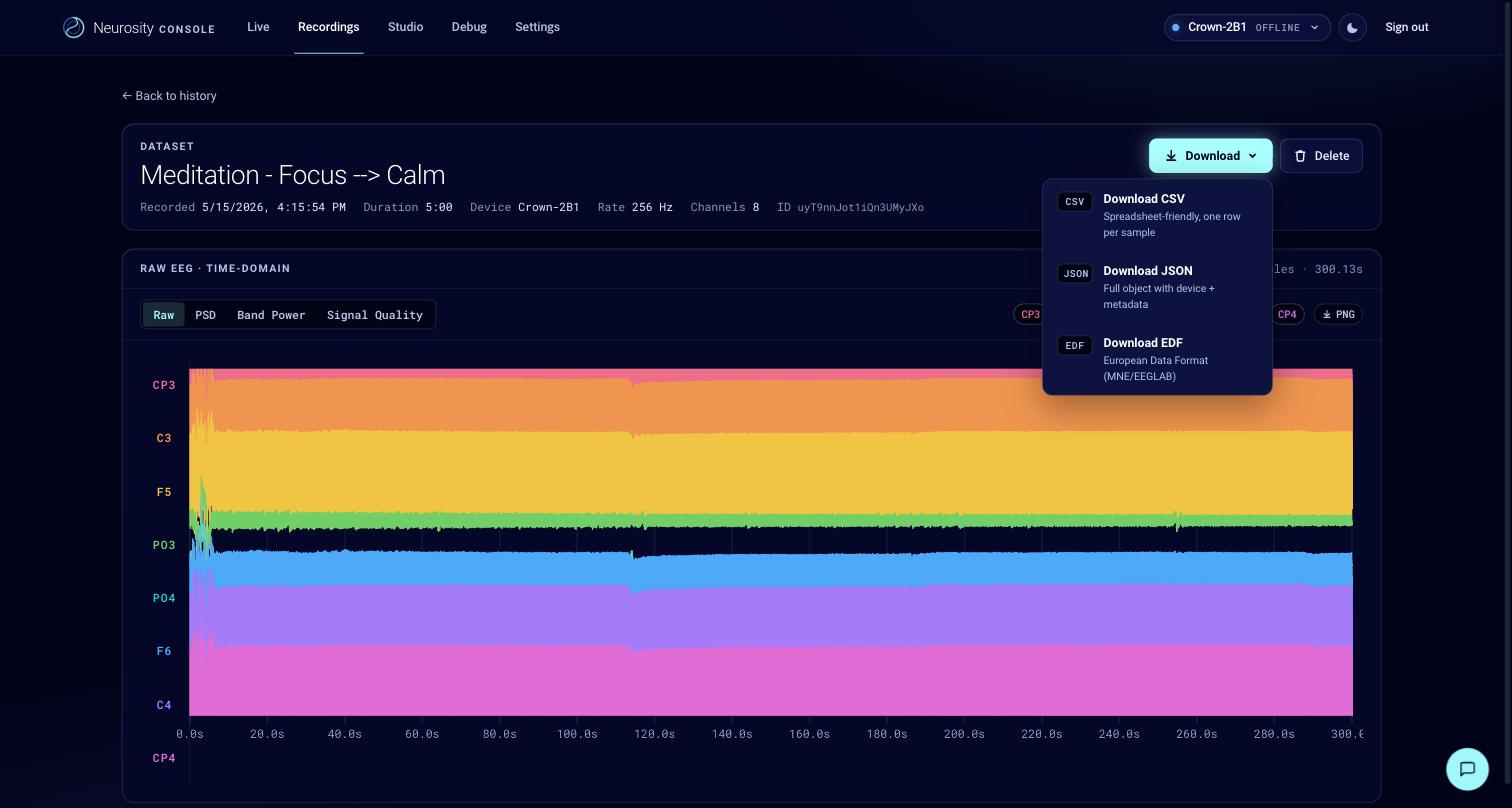
One row per instant, 256 a second, a column per channel of raw microvolts. About 76,000 rows for five minutes. Raw signal only: no focus, calm, or band power.
The complete, honest raw material, and what the worked session is built on. Everything else is computed from it, so every claim is checkable.
Use it to analyse a session yourself, and reproduce or challenge the console.
| Col | Contents | What to know |
|---|---|---|
| 1 | 0, 1, 2 ... | Sample index |
| 2 to 9 | CP3 C3 F5 PO3 PO4 F6 C4 CP4 | Voltage per electrode, in that fixed order |
| 10 | (blank) | Always an empty string, never populated |
| 11 | 1776183430474.751 | Millisecond timestamp |
There is no header row, so line one is already sample zero. Open one of these in a spreadsheet and it will silently consume your first sample as column names. The timestamps also step backwards once or twice per file and contain occasional gaps, so slicing by time rather than by index will misbehave.
JSON, "full object with metadata"The same samples wrapped with device details. For code, not spreadsheets.›
The recording as a structured object: samples plus metadata (device, channels, rate, timestamps, id).
For a program that wants the context bundled in, not a spreadsheet.
EDF, European Data FormatThe research-standard format. The door out to real EEG tools like MNE.›
The clinical and research EEG standard, readable by MNE and EEGLAB.
Its presence says Neurosity expects the real analysis to happen elsewhere. The console is a viewer; this is the door out.
Use it to hand data to a researcher or an existing pipeline.
The channel names, CP3 C3 F5 PO3 PO4 F6 C4 CP4Eight sensor positions. The back-of-head PO channels are cleanest and best for alpha.›
Standard 10-20 positions. Letter is the region (F frontal, C central, CP centro-parietal, PO parieto-occipital), number is the side (odd left, even right).
F5, F6 are frontal, near attention but also face muscles, so noisy. C3, C4 sit over motor cortex, the spot for imagined movement. PO3, PO4 sit at the back over visual areas, where alpha is strongest and contact is cleanest.
For relaxation and meditation, trust the PO channels most. For intention or movement, the C channels. Distrust frontal unless quality is good.
ReferenceWhat each band is telling you
The five bands the console splits your signal into, what each one tracks, and how much weight it will bear on this hardware. The case studies link here rather than restating it per session.
1DeltaMostly drift and movement in a waking recording, not brain rhythm.0.5 to 4 Hz›
In a waking recording this is mostly drift and movement rather than brain rhythm. Treat a rise here as a question about the headset, not about you. It also dominates every channel, 72 to 95% of the power in the sessions read for the case studies, which is why band shares only compare between recordings and are never read as absolutes. The band runs from 0.5 Hz; every figure quoted on this site starts at 1 Hz instead, because the analysis pipeline high-passes there to remove electrode drift.
2ThetaDrowsiness, deep internal focus and memory load all raise it. Read it next to alpha.4 to 8 Hz›
Drowsiness, deep internal focus, and memory load all raise it. Rising theta late in a long eyes-closed session is the signature of drifting toward sleep. Rising theta during effortful mental work is the opposite: concentration. Which one you are looking at depends on what alpha is doing at the same time.
3AlphaRelaxed wakefulness, and the most reliable thing an eight-channel headset can show you.8 to 13 Hz›
Relaxed wakefulness, and the most reliable thing an eight-channel headset can show you. It surges over the back of the head when you close your eyes and drops when you engage with something demanding. It is the band the posterior electrodes, PO3 and PO4, are best placed to catch.
One range to keep straight: alpha is usually quoted as 8 to 12 or 8 to 13 Hz, but the calm score specifically uses 7.5 to 12.5 Hz. Both are right, they describe slightly different things.
4BetaActive, engaged thinking, and where muscle tension starts to leak in.13 to 30 Hz›
Active, engaged thinking. Also where muscle tension starts to leak in, so read it alongside the quality verdict rather than on its own.
5GammaNominally peak integration. On dry consumer electrodes, badly contaminated by jaw and brow muscle.30 to 44 Hz›
Nominally peak integration, but on dry consumer electrodes this band is badly contaminated by jaw and brow muscle. This is the band the focus score is built from, which is the whole reason I rank focus below calm. That ranking is my own conclusion, not a vendor claim.
None of this is diagnostic. The Crown is a consumer wellness device, and the honest ceiling of what eight dry electrodes can tell you is state, not condition.
The vendor's numbersWhat Neurosity publishes, in one place
Everything above is what the console does not tell you. This is what it does, taken from Neurosity's own documentation rather than from my recordings.
| Focus | Calm | |
|---|---|---|
| Built from | gamma | alpha |
| Range | 30 to 44 Hz | 7.5 to 12.5 Hz |
| Counts above | 0.3 | 0.3 |
| Warm-up | about 16 s | about 16 s |
| Aim for | |
|---|---|
| Live voltage | 10 to 100 µV |
| MVRMS (the console's normalised quality figure, not microvolts) | 0.01 to 0.05 normally; above 0.2 is artifact |
| Std deviation (the console's own per-channel criterion, in its units, not the microvolt figures computed further down this page) | 1.5 to 10 |
| Average quality | above 70% usable, above 80% good |
| Session coverage | above 75% |
Source: Neurosity documentation, Focus and Calm, for both bands, the 0.3 threshold and the 16-second initialisation.
AppliedOne session, interpreted end to end
A real recording taken from raw signal to a verdict, using the discipline this guide preaches. The Meditation → Focus → Calm session, five minutes, exported as raw CSV.
Start from the raw file, and check it matches
The CSV holds 76,832 samples across 8 channels at 256 Hz, which is 300.1 seconds. That matches the console's metadata exactly, so the file is parsed right before anything is read into it.
Rebuild the signal quality, and reverse-engineer the method
A raw standard deviation did not match the console. Removing the slow drift first (a 1 Hz high-pass) reproduced their numbers on all eight channels, confirming the parse and revealing how the console computes signal quality.
| Channel | Recomputed µV | Console µV |
|---|---|---|
| C3 | 4061 | 4063 |
| F6 | 4013 | 4014 |
| C4 | 4791 | 4793 |
| PO3 | 226 | 231 |
| PO4 | 123 | 129 |
The pattern is the point: six channels swing by 2,200 to 4,800 µV of artifact, while PO3 and PO4 are 15 to 30 times cleaner. Frontal and central sensors sit near face and neck muscles; the back of the head stayed quiet.
Read the meditation through the clean channels only
Posterior is where alpha, the relaxation rhythm, is strongest, so the two clean channels are the right ones anyway. Reading alpha's share minute by minute at PO4 rather than averaging the session flat, it climbs steeply and then eases: 6.1% in the first minute, 13.5%, then 29.7% at minute three, falling back through 26.4% and 18.6%. The peak is at minute three, not at the end, which is the shape a wind-down makes and not the shape a slow drift makes.
State the verdict at the strength the evidence allows
A clear rise in posterior alpha across the first three minutes, easing afterwards, consistent with settling into a calmer, more inward state and then drifting past it. Which is what a meditation would predict.
Still held loosely on purpose: five minutes is short, one session is not a pattern, and only two of eight channels survived. The figures above are the console’s own statistic, a 1 Hz high-pass standard deviation. Re-measuring the same file the way the session pages do, on 1 to 45 Hz band-passed RMS, scales every channel down by about four but changes nothing about the ranking: PO3 and PO4 come back at 71 and 51 while the other six sit between 550 and 1,212. Both measures name the same two usable channels. The honest conclusion is "a clear settling curve, on a recording clean enough in only two places to say even that". To earn a firmer verdict, re-record with better contact.
The minute-three peak is the part that has been checked twice. An independent reimplementation of this analysis pipeline reproduced it under every preprocessing variant it tried, which is recorded in the crown-debrief repository. The percentages above are this site's own, computed with the Butterworth and Welch method stated at the top; a different pipeline gives different percentages and the same shape.
That restraint is the demonstration. Anyone can narrate a dramatic arc from noisy data; the skill is checking quality first and matching the claim to the evidence.
Explore more
This site covers what the documentation doesn't: the things I wish someone had handed me first.